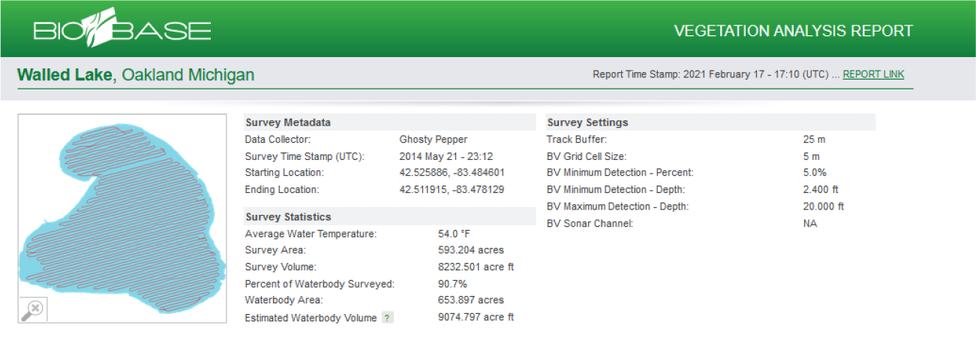
The Vegetation Analysis Report summarizes a detailed information about the processed trip in BioBase.
General information of the processed trip
Use the Report link button to update the Vegetation Anlaysis Report of the selected trip in BioBase.
Survey summary
The breakdown of how biovolume is distributed throughout the waterbody is presented in the report. For instance, if 75% of the data points were biovolume greater than 80%, then most vegetation was dense and near the water surface.
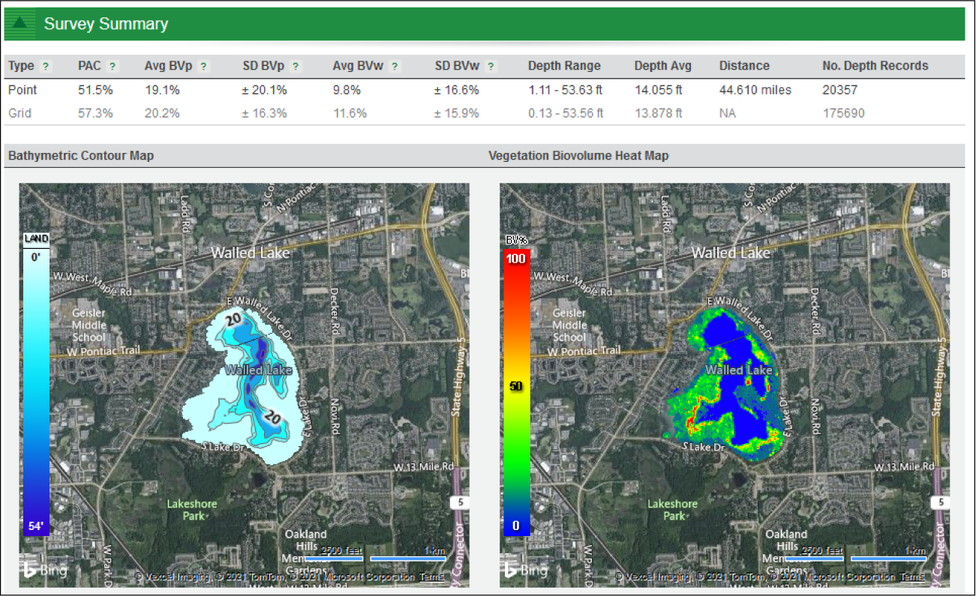
| Full survey | |
| Point | Point summaries represent basic statistical summaries on the
coordinate points along the trip path. A single point represents a
summary of sonar/echosounder pings and the derived bottom and canopy
depths. Individual point data create an irregular spaced dataset
that may have overlaps and/or gaps in the data resulting in an
increased potential for error. Note: For
linear transects travelled at a constant rate of speed,
statistical summaries of the point data are preferred to the
grid.
|
| Grid | Grid summaries are statistical summaries derived from kriging and are most appropriate for whole lake surveys, irregular trip paths (e.g., merged trips), clumped coordinate data, or variation in data collection protocols of repeated surveys. Geostatistical interpolated grid and evenly spaced values representing kriged (smoothed) output of aggregated data points. The gridded data is most accurate summary of individual survey areas. |
| Biovolume (plant) or BVp |
Biovolume (plant) or BVp is the average percent biovolume within a surveyed area where vegetation was present. Areas that do not have any vegetation are not taken into consideration for this calculation. |
| Biovolume (water) or BVw | Biovolume (water) or BVw is percent biovolume in the entire surveyed area including areas with no vegetation. In areas where no vegetation exists, a zero (0) value is entered into the calculation. This will reduce the overall biovolume of the entire area covered by the survey. |
| Vegetation biovolume heat map | Displays the transect design and the percentage amount of the vegetation biovolume heat map. |
Manual depth and vegetation coordinates
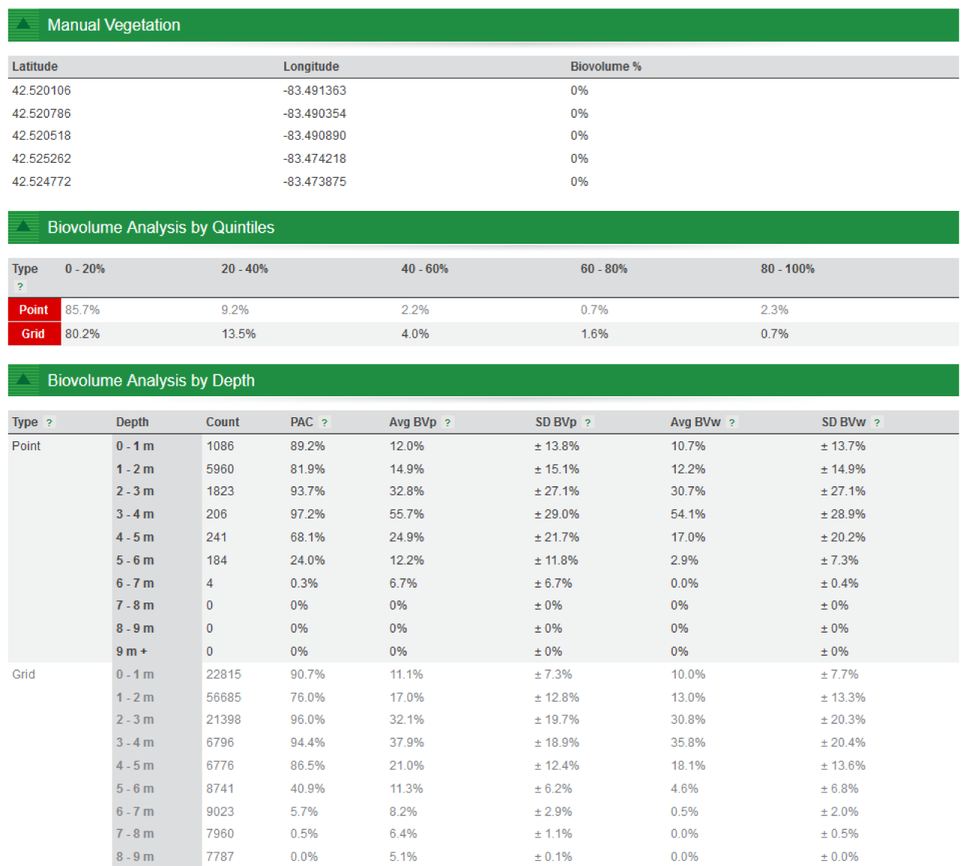
Lists manually added depth and percentage biovolume data points.
Biovolume analysis by quantity
Indicates the percentage amount of the vegetation biovolume on a given quantity.
Biovolume analysis by depth
Indicates the percentage amount of the vegetation biovolume on a specific depth. Standard deviations (SD) are also presented which give an indication of how variable vegetation growth was within the surveyed area.
Glossary
Displays the list of terms and definitions used in the EcoSound summary report.
Additional waypoints
Displays a chart with manually added waypoints and a list of its associated GPS coordinate data.
Offsets
Displays a list of manually added offset depth used in the calculation.
Report URL
You can share the EcoSound summary report to anyone by distributing the web link. Anyone who has the web link will be able to view the report.
To ensure you have the correct web link, refresh the page by clicking the report link button. The button is available on the upper right side of the EcoSound summary report page. Copy the web link from the address bar and send it using your email or any messaging system.